
For the past few decades, researchers have been collecting ice cores from Alaska and Western Canada to study and compare past climate with today. Mostly recently, the team I’ve been working with from U Maine, U New Hampshire, and Dartmouth College, collected an ice core from Mt. Hunter in Denali National Park (website link here).
Based on lab analysis, the core appears to contain at least a 2000 year climate record. As a team we are already using this core to answer questions like:
- How warm or cold was it over the past 2000 years and how have temperatures changed in this area of the world?
- How have climate circulation patterns changed?
- How much aerosol pollution travels around the planet, and has the amount changed over time?
- How have accumulation rates changed over time? Are we getting more accumulation or less accumulation? This is one of the questions I am personally trying to answer, so I’ll talk a little about what it will take to answer this question.
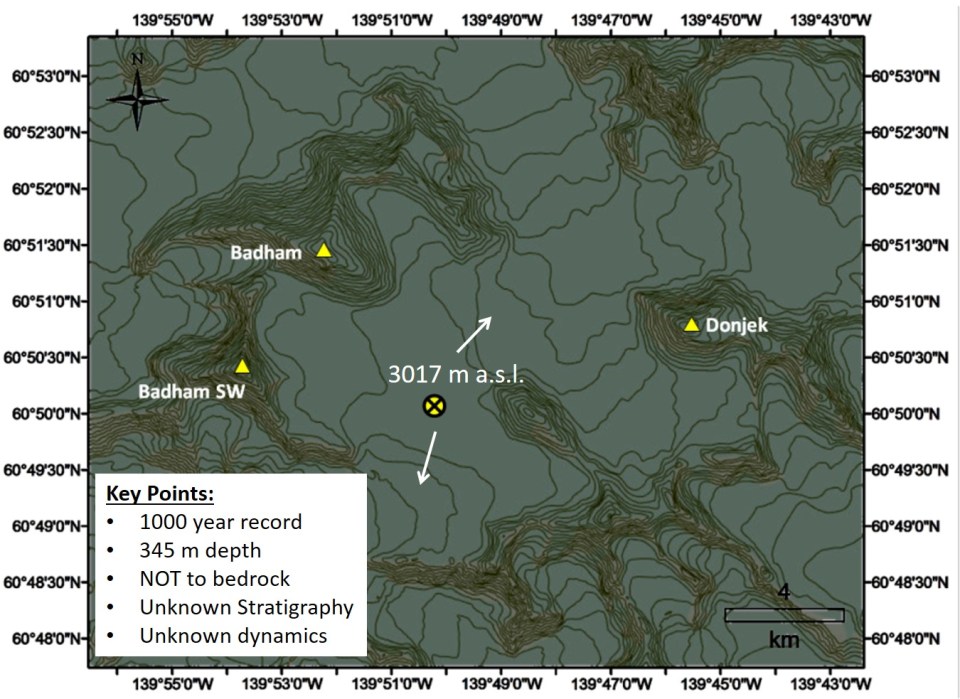
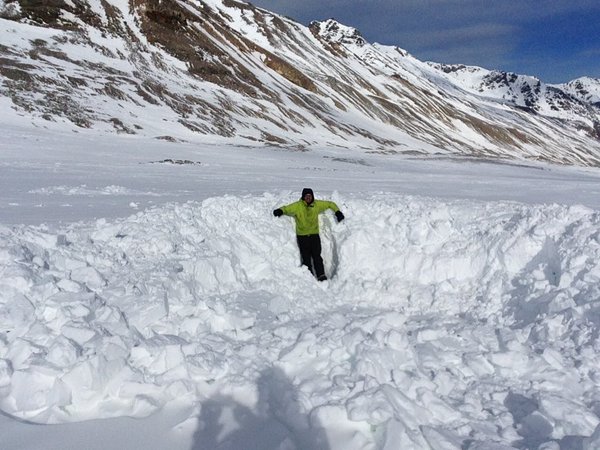
One of the ultimate goals of our Kluane National Park research is to create a direct comparison of accumulation rates between ice core records extracted from Pacific Northwest North America. In contrast to the Mt. Hunter ice core site, little is known about the geophysical characteristics of several other ice core sites in coastal Canada (PR Col, NW Col, King Col on Mt Logan and the Eclipse Icefield), which were drilled between 1980-2002, prior to recent advances in geophysical techniques and numerical modeling capability. This lack of information would introduce uncertainty in any comparison between St. Elias and Mt. Hunter accumulation records.
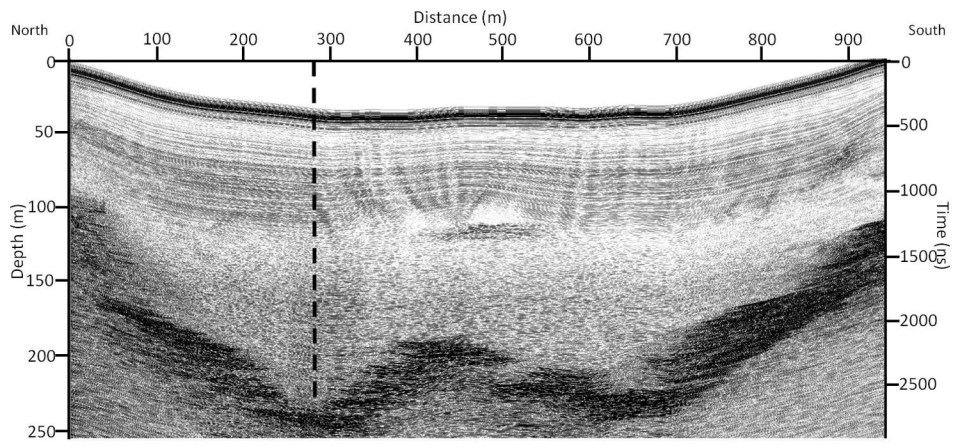
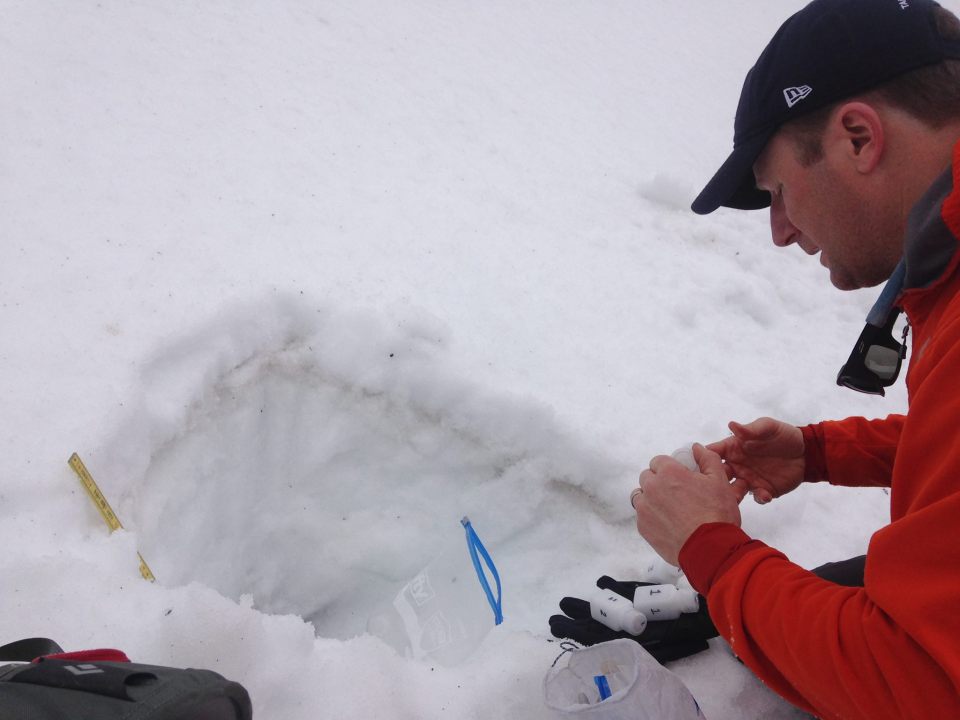
Consequently, our team specifically proposes to improve ice core-based accumulation records through the collection of new geophysical data at some of these past ice core sites. Our science objectives this year are on the Eclipse Icefield and include the following: 1) develop bedrock topography maps of the Eclipse Icefield, King Col, and Mt. Logan summit plateau sites; 2) determine surface velocities at all sites; 3) map near-surface spatial accumulation rate patterns; 4) trace internal isochrones at all sites; 5) estimate ice deformation effects on layer thinning; 6) produce updated, to 2016, and corrected accumulation time series at all sites; and 7) compare corrected accumulation records from the Mt. Hunter and St. Elias sites to evaluate spatial accumulation patterns over the past millennium. The research strategy necessitates the use of state-of-the-art ground penetrating radar (GPR), geochemical, satellite remote sensing, numerical modeling, and data synthesis techniques.
Jenga, Escalators, and Pancakes: Where do we choose to collect ice cores and why do ice cores retain a climate record?
Before we dive into how we study accumulation from ice cores, you may ask:
How do we pick an ice core site in the first place?!?
I’ll use a simple mountain glacier (like one in Alaska or Canada) to answer this question because the ice cores we are working with originated from such systems (note: not all glacier systems are the same so this is a very simplified example!) Glaciers are created at high elevation where yearly snowfall accumulates year after year. At high elevation minimal melting occurs due to cold temperatures year-round, allowing snow to build up over time. Snow that is buried deeper and deeper eventually turns into ice from compression and other mechanisms. At some point, so much snow and ice builds up that the entire mass starts to flow downhill, deforming under its own weight due to gravity. Perhaps, compare this to the classic game, Jenga: the wooden blocks can only stack so high until it all falls down! As the ice flows downhill to lower elevations, warmer temperatures causes melting, effectively reducing the glacier ice volume.
A glacier in “steady state” has the same amount of accumulation occurring at higher elevation relative to the amount of volume being lost at lower elevation via melting. Basically, a glacier is like a constant escalator or conveyor belt that you see at the airport, only it’s made of ice and goes through a cycle of accumulation at high elevation and ablation (a fancy term for mass loss) at low elevation. As a side note, most glaciers are not in a steady state. Many of them are losing mass far more quickly than gaining mass, hence the worldwide concern for sea level rise impacting all of society.
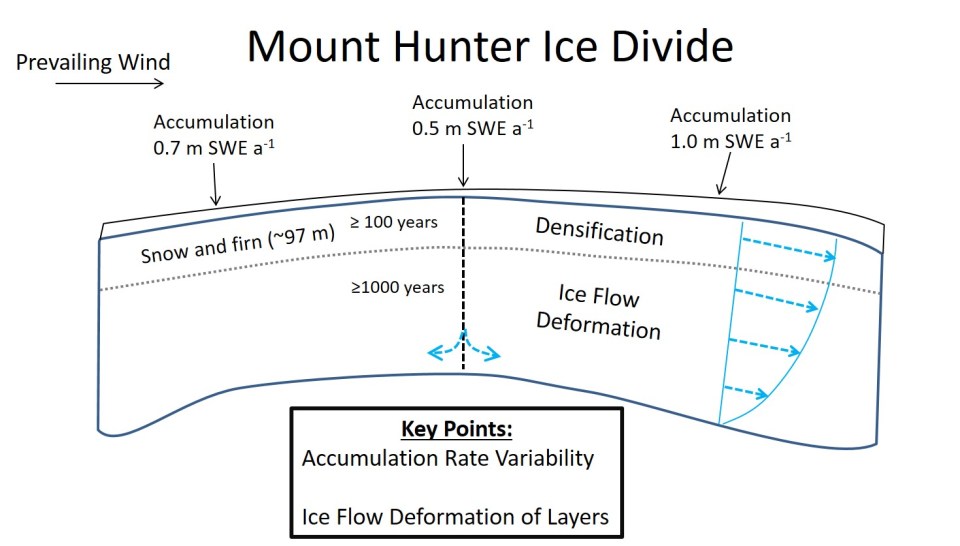
As you can see, layers in a mountain glacier from individual snowfall events represent distinct periods in time. If those layers are not melted or significantly deformed, then they are representative of the chemical constituents in the atmosphere that carried the original snow to its point of deposition. By logic, ideally we collect ice cores at locations which have the least amount of layer deformation or melt because that deformation (from ice flow for example) or melt, disturbs the original chemical signal (the climate record) of interest. These two factors should make you recognize that high elevation sites where no significant melting occurs, makes for the best ice core sites. Secondly, these high elevation sites also represent areas where the least amount of layer deformation has occurred from ice flow. If we can find a site where the ice barely flows and no melting occurs that’s our goal. Ice divides in the dry snow zone (an elevation where it is so cold on a daily basis and year-round, that no melting occurs) make the best locations for ice core extractions because the layers of snow and ice are basically like a stack of pancakes.
My pancake analogy goes like this: If you cook pancakes in the morning for breakfast the first pancake you make is on the bottom of the stack on your plate. The last pancake you cook is on the top of the stack. The pancakes are stacked oldest to youngest from the bottom to top, respectively. A good ice core record is just like a stack of pancakes that has not been disturbed yet! As soon as I dump syrup or ice cream onto my pancakes, both of which soak into the pancake altering the “layers” (yes, ice cream is amazing on pancakes!), or if I cut the pancakes up into tiny little pieces and stir them all around on my plate, they are no longer in their original state of “deposition” making it difficult to figure out relative ages and chemical records because both have been altered. Make sense? SO, we want to take a core from a stack of pancakes that hasn’t had syrup or ice cream dumped on it yet (no melting) and hasn’t been cut up into tiny little pieces (deformed).
Candy Bars and Time Travel: How do we determine accumulation rates from ice cores?
No matter where we extract an ice core, even at an ice divide (which is basically a perfect place for ice cores because of their high elevations meaning minimal melting and very small ice flow velocities meaning minimal layer deformation), the layers within the core experience some type of deformation over its lifetime sitting within the glacier. Logically, layers that have been within the glacier for a long time will experience more deformation than layers which have most recently been deposited. That is, a layer can accumulate deformation over time. Here is a simple analog:
Grab the two ends of any gooey candy bar (a Snickers perhaps?) and slowly start pulling the bar apart, end to end. The longer you pull on the two ends of the bar, the thinner and thinner the bar gets until eventually it breaks. The analogy to a candy bar breaking is an ice layer within a glacier becoming so thin from ice flow, that it is no longer continuous.
To determine accumulation from a single layer within a glacier we need to first determine 1) the current thickness of an annual layer; and 2) how much deformation the layer experienced since it was originally deposited. To determine how much deformation a layer has experienced, we need to know how long the layer has been within the glacier (its age) which we can determine from chemistry, a different blog all together! To estimate how much deformation the layer experienced, we create numerical models that predict the amount of layer deformation based on physical properties of ice and other constraints we can apply to the model such as the dimensions of the glacier and how fast the ice is flowing within the glacier.
A good analogy for this modeling effort (called inverse modeling) is that we are trying to travel back in time to see how thick the layer of snow was when it was initially deposited. Another analogy is playing a movie in reverse. If you watch a time lapse movie backwards of a glacier flowing, you would see the layers deform back to its original state (into the thickness of the layer we are trying to determine)!
We rely on a suite of field data to create and constrain our computer numerical models. The computer model includes information such as glacier geometry (ice thickness in 3-dimensions), ice flow velocity (how fast the ice is moving and in what direction), boundary conditions (such as is the ice frozen to the bed, or is the ice sliding across the bed), and internal layers which are caused by snowfall events over many years. Our combined glacier observations and numerical model will allow us to remove influences of ice flow (which causes layer thinning).
Click here to play a video of a Mount Hunter numerical model showing ice flow velocities. (Note: model created by Samuel Roy and Seth Campbell, University of Maine)
There is so much more we are trying to complete this year at the Eclipse Icefield, our field site that we will visit in less than a week. BUT, this is a good start to why we are going to the site in the first place. Stay tuned for more blogs about this effort to learn more!
The Team…
Here is a little about our team for the 2016 Eclipse Icefield research:
Karl Kreutz: I am a professor in the School of Earth and Climate Sciences at the University of Maine and have been working on ice core projects in the Arctic and Antarctic for the past twenty years. My projects have included ice core sites in the St. Elias Mountains (Canada) Brooks Range and Alaska Range (Alaska), the Dry Valleys (Antarctica), West Antarctica, and several mountain ranges in Asia. I am a “paleo-climatologist” meaning that I specialize in studying past climate. I use a variety of methods such as the chemical analyses of ice cores to complete my research and I am most interested in studying how climate has changed over the past 10,000 years (a time period which geologists call the Holocene). My pastimes include all kinds of outdoor recreation, and with my wife, Sara, getting our two children to their numerous soccer, hockey, and other after-school or summer activities!
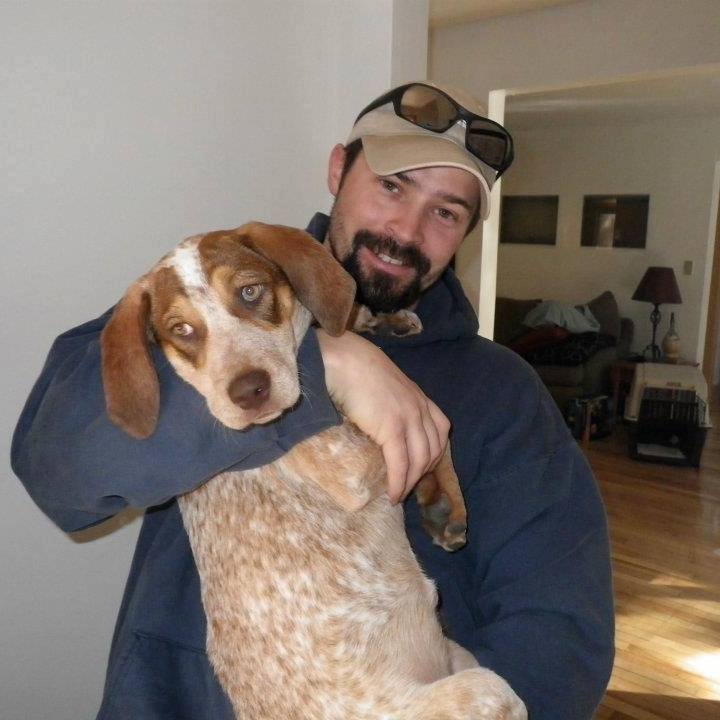
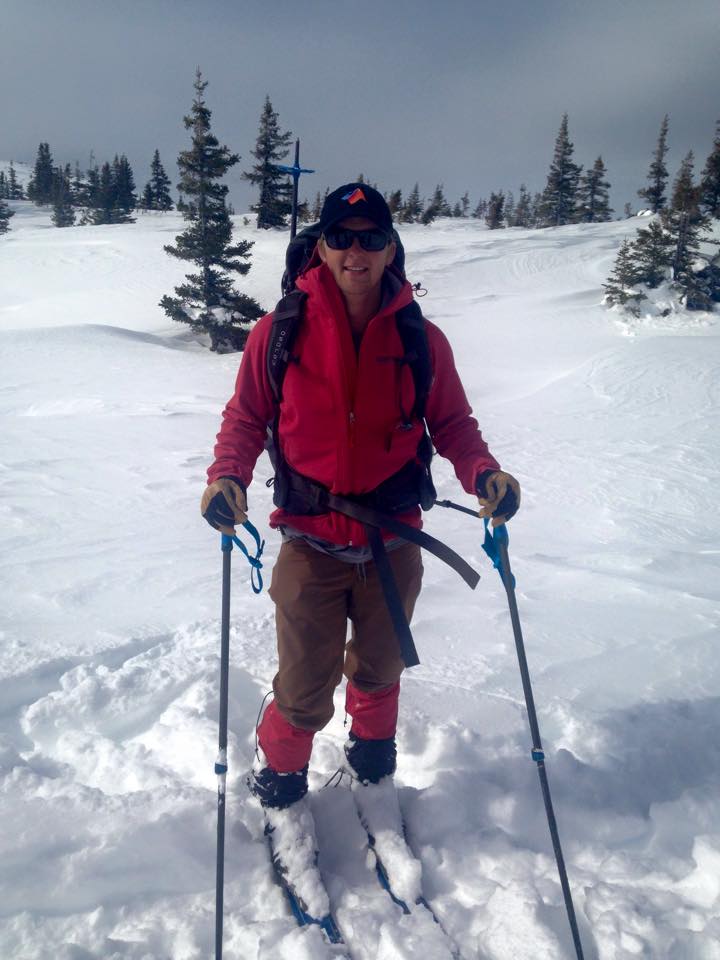
Seth Campbell: I am a Research Assistant Professor for the School of Earth and Climate Sciences at the University of Maine and the co-PI on this project. I have other affiliations with the Cold Regions Research & Engineering Laboratory (CRREL) and University of Washington. I specialize in using geophysics as tool set to study all things frozen including accumulated snow, ice, and permafrost (frozen ground). I also have an interest in studying near surface geology of areas which have been covered by glaciers in the past. During my free time I enjoy rock and ice climbing, mountaineering, and spending time with my wife Kristin, and our Coonhound, Kinley. I love ice cream and bacon!
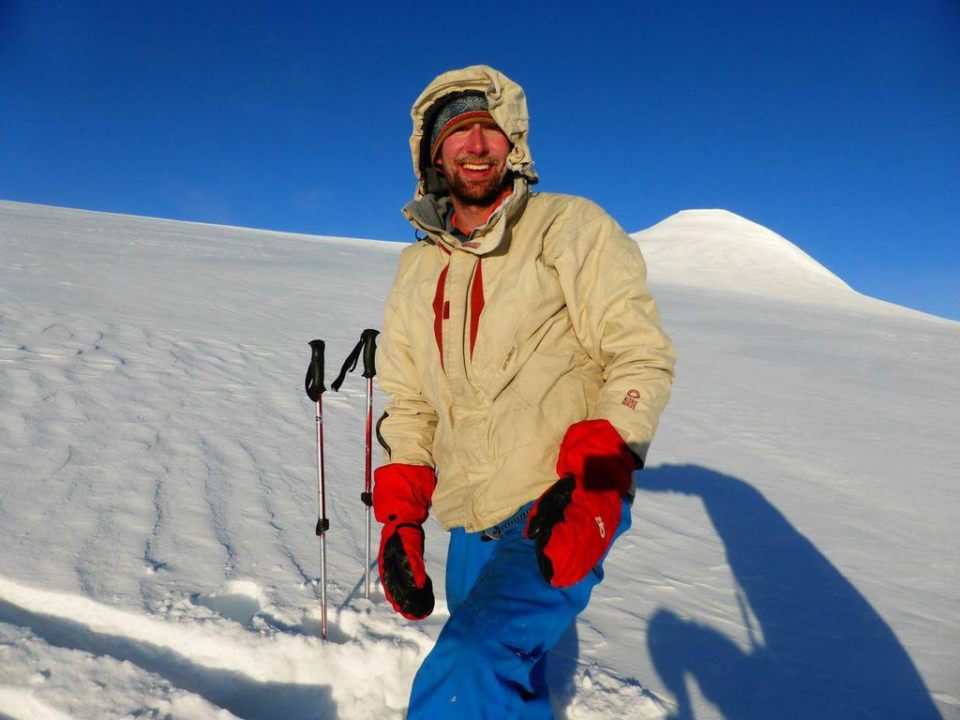
Dominic Winski: I am in the 3rd year of my PhD in the earth science department at Dartmouth College. My research interests center around the relationship between the atmosphere and cryosphere. I collect and analyze ice cores from alpine glaciers to learn about the history of temperature and snow accumulation. I am also concerned with how changes in climate affect glacial mass balance and the physical and chemical properties of snow. My current work surrounds an ice core record from Mt. Hunter in the Alaska Range. I enjoying hiking whenever possible. (NOTE: We call Dom the Ox because he has become invaluable to all our efforts over the past six field seasons in Alaska and now Canada. We also count Dom as two people in the field for food shopping purposes! I challenge anyone to try to out-eat Dom!)
Steve Bernsen: I earned my B.S. in geology from Portland State University in 2013, then moved to New Mexico and completed an M.S. in geophysics at New Mexico Institute of Mining and Technology. Three days later I started my PhD in SECS (School of Earth and Climate Sciences) at the University of Maine and I’m finishing up my first year. Following the strict leisure requirements of the university, I spend time rock climbing, backcountry skiing, mountain biking, trail running and canoeing followed by a few drinks at the local brewpub. When I do find time to work I stare deeply into my computer at waveforms trying to find the meaning of elastic and EM wave propagation in a heterogeneous monomineralic medium.
Justin Leavitt: I am a senior at the University of Maine studying earth science and anthropology. I enjoy spending my spare time outdoors hiking, power kiting canoeing, scuba diving and sailing. I also enjoy reading, watching too many movies and playing guitar (very averagely). My landlord has a cat that I have grown attached to but technically, I do not own any pets. My favorite foods are of the breakfast variety and my favorite candy is werther’s original. I am an old man in a young man’s body.

Dorota Medrzycka: I’m currently working on my Ph.D. at the University of Ottawa. My research is focused on the dynamics of surge-type glaciers in the Canadian High Arctic. My project combines fieldwork (focused on Axel Heiberg Island) and remote sensing techniques to gain insight into the physical mechanisms which trigger and control the dramatic speedups observed under surge conditions. When I’m not working I enjoy playing outside, climbing, ski touring and general bumming around in the outdoors.

Patrick Saylor: I am a senior at Dartmouth College pursuing a double major in Earth Sciences modified with Biology, and Environmental Engineering. I am very interested in just about everything related to polar sciences, global atmospheric circulation dynamics and using ice core data to investigate these relationships through time. For my senior thesis I am exploring relationships between Asian dust transported across the Pacific and marine productivity (measured in ice cores using methane sulfonate, or ‘MSA’). I have also discovered a love for emergency medicine, which has led to volunteering as an EMT with local VT/NH search and rescue. In my free time I most enjoy getting outside with my family, backcountry skiing, climbing, and enjoying the simple things in life. Like cookies.
Daniel Dixon: I’m the Campus Sustainability Director and a Research Assistant Professor within the University of Maine. I received a Bachelor’s Degree from the University of Southampton, UK, and M.S. and PhD in Earth Sciences while working at the University of Maine’s Climate Change Institute. My graduate work was primarily based in Antarctica where I completed five Antarctic field seasons traversing over the ice sheet and drilling >40 ice cores along the way. I currently work to understand how the Antarctic ice sheet behaves over long and short timescales and how these changes affect global climate. I have also worked in Southern Patagonia, the New Zealand Southern Alps, the Central Chilean Andes, and on South Georgia Island. As the UMaine Sustainability Director, I work closely with all levels of university leadership to advance UMaine’s ongoing commitment to sustainability. In my spare moments, I enjoy spending time with my family, hiking, biking, exploring, watching movies, eating healthy and delicious locally-sourced foods, and building really big train track layouts with my 4-year old son.

